
The Data Factory: How to Overcome the Chaos of Energy Data
- Nov 7, 2025
- 4 min read
Updated: Nov 10, 2025
Note: This article uses examples from French data sources (BDNB, DPE, DLE), but the principles apply similarly across Europe and North America.

The Hidden Cost of Energy Projects
Here's one of the questions we've been asked most often: "Given the diversity of energy data sources and formats, how do you avoid getting lost (or wasting your time)?"
Many of our clients have admitted to spending up to 50% of their project time on data reconciliation.
Not on analysis. Not on design. But on cleaning, cross-referencing, and arbitrating between contradictory sources. This is a reality of the energy sector: engineering firms, district heating operators, and public authorities are constantly juggling dozens of data sources.
To name just a few of the sources available in France:
BDNB (National Building Database)
DPE (Energy Performance Certificates)
DLE (Local Energy Data)
Internal Excel files (field surveys, past projects...)
CRM exports or online survey data
And the most ephemeral (and too often overlooked): the watercooler ("My colleague mentioned during break that this customer changed their heating system...")
Each source has its own logic and advantages, but also its gaps and inconsistencies. Daily work quickly fills up with Excel file exchanges, cumbersome databases to download, and workarounds in QGIS.
It's this time-consuming chaos that plagues the industry—and slows down the energy transition—that motivated us to develop Urbio's Data Factory.
No Source Is Perfect
The energy data landscape is fragmented and heterogeneous by nature.
National databases like the BDNB offer a wealth of data but generally lack local precision. Energy Performance Certificates are information-rich but cover only a fraction of buildings. Your own field data is ultra-reliable but often limited to a sample of buildings.
Our conviction: the "best" source doesn't exist. It's the intelligent combination of multiple sources that makes the difference.
That's why Urbio works differently. Instead of imposing a rigid and opaque source, our Data Factory gathers, merges, and makes transparent dozens of energy sources.
With two specific advantages unique to our platform.
The Data Factory's Dual Advantage
Custom Hierarchy
Imagine a "cascade" system where you define the priority order of sources for your digital twin yourself. You choose which sources to use as a priority, and which to use as a "safety net" when preferred data is missing.
Result: every building is documented (100% coverage guaranteed), and is assigned the best available value.
Continuous Enrichment
Energy infrastructure projects often evolve over months, sometimes years. So does their data.
That's why Urbio isn't a static database. You detect an anomaly on a building? Correct it directly on the map. New survey campaign? Import your Excel file.
The digital twin evolves with your project. No disruption, no massive re-import. Just continuous improvement within a single, reliable, collaborative reference framework—a "Single Point of Truth" or SPOT.
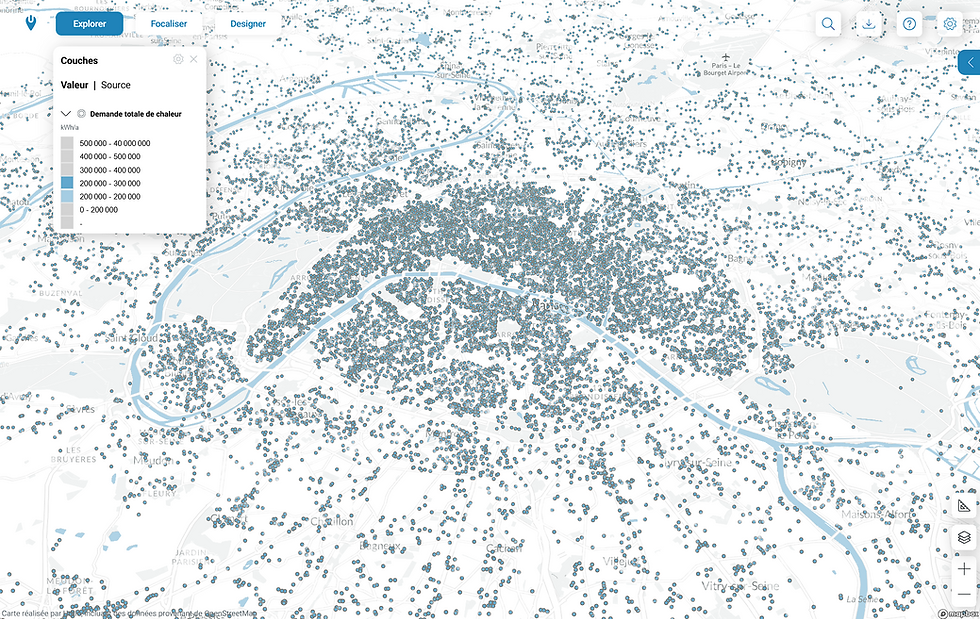
Practical Case: Estimating a Municipality's Thermal Demand
You're an engineering firm tasked with planning the district heating network master plan for a municipality with 2,000 buildings. Your objective: map heat demand and identify promising buildings.
With a traditional approach—several days:
You download the BDNB (over 30 GB, complex format)
You cross-reference with available DPE data (only 20% coverage)
You spend 2 days in Excel cleaning, removing duplicates, arbitrating
You re-import everything into your local QGIS
You end up with partial coverage—and doubts about the origin of each value
With the Data Factory—10 minutes:
You upload your Excel file with actual consumption measurements
You configure your hierarchy in 2 minutes, for example:
1. Your Excel File
2. DLE (Local Energy Data)
3. DPE (estimate based on Energy Performance Certificate)
4. Urbio statistical model (BDNB/DLE)
5. Urbio default value
You detect an error for a known building? Correct the data manually and place the new source at the top of the hierarchy: 0. Manual entry
In just a few minutes, the Data Factory automatically merges everything—building by building. If data 1. is missing for a building, it moves to layer 2., and so on. Important point: the source used for each building remains 100% traceable.
You therefore start your analysis immediately to feed your opportunity note or district heating feasibility study. And, throughout the project, you enrich it: new readings, manual corrections, CRM data integration.
Why It's Different
Most energy simulation tools treat data as a static and opaque input. Urbio treats it as a living, modular asset.
Total transparency: Every displayed value indicates its origin. You always know which source was used.
Granular control: Every project, every region is unique: you define the rules, you choose the sources that fit your situation.
Scalability: The approach works for 10 buildings as well as 1,000,000. And today, as well as tomorrow, thanks to the ability to edit and collaborate on a common platform.
The chaos of energy data isn't inevitable. So what to do with the 50% of expert time saved? It's reinvested where it truly matters: the analysis, design, and deployment of renewable infrastructure that decarbonizes the building sector.
Want to use Urbio's digital twin in your next project? Test it for free here 👉 https://www.urb.io/